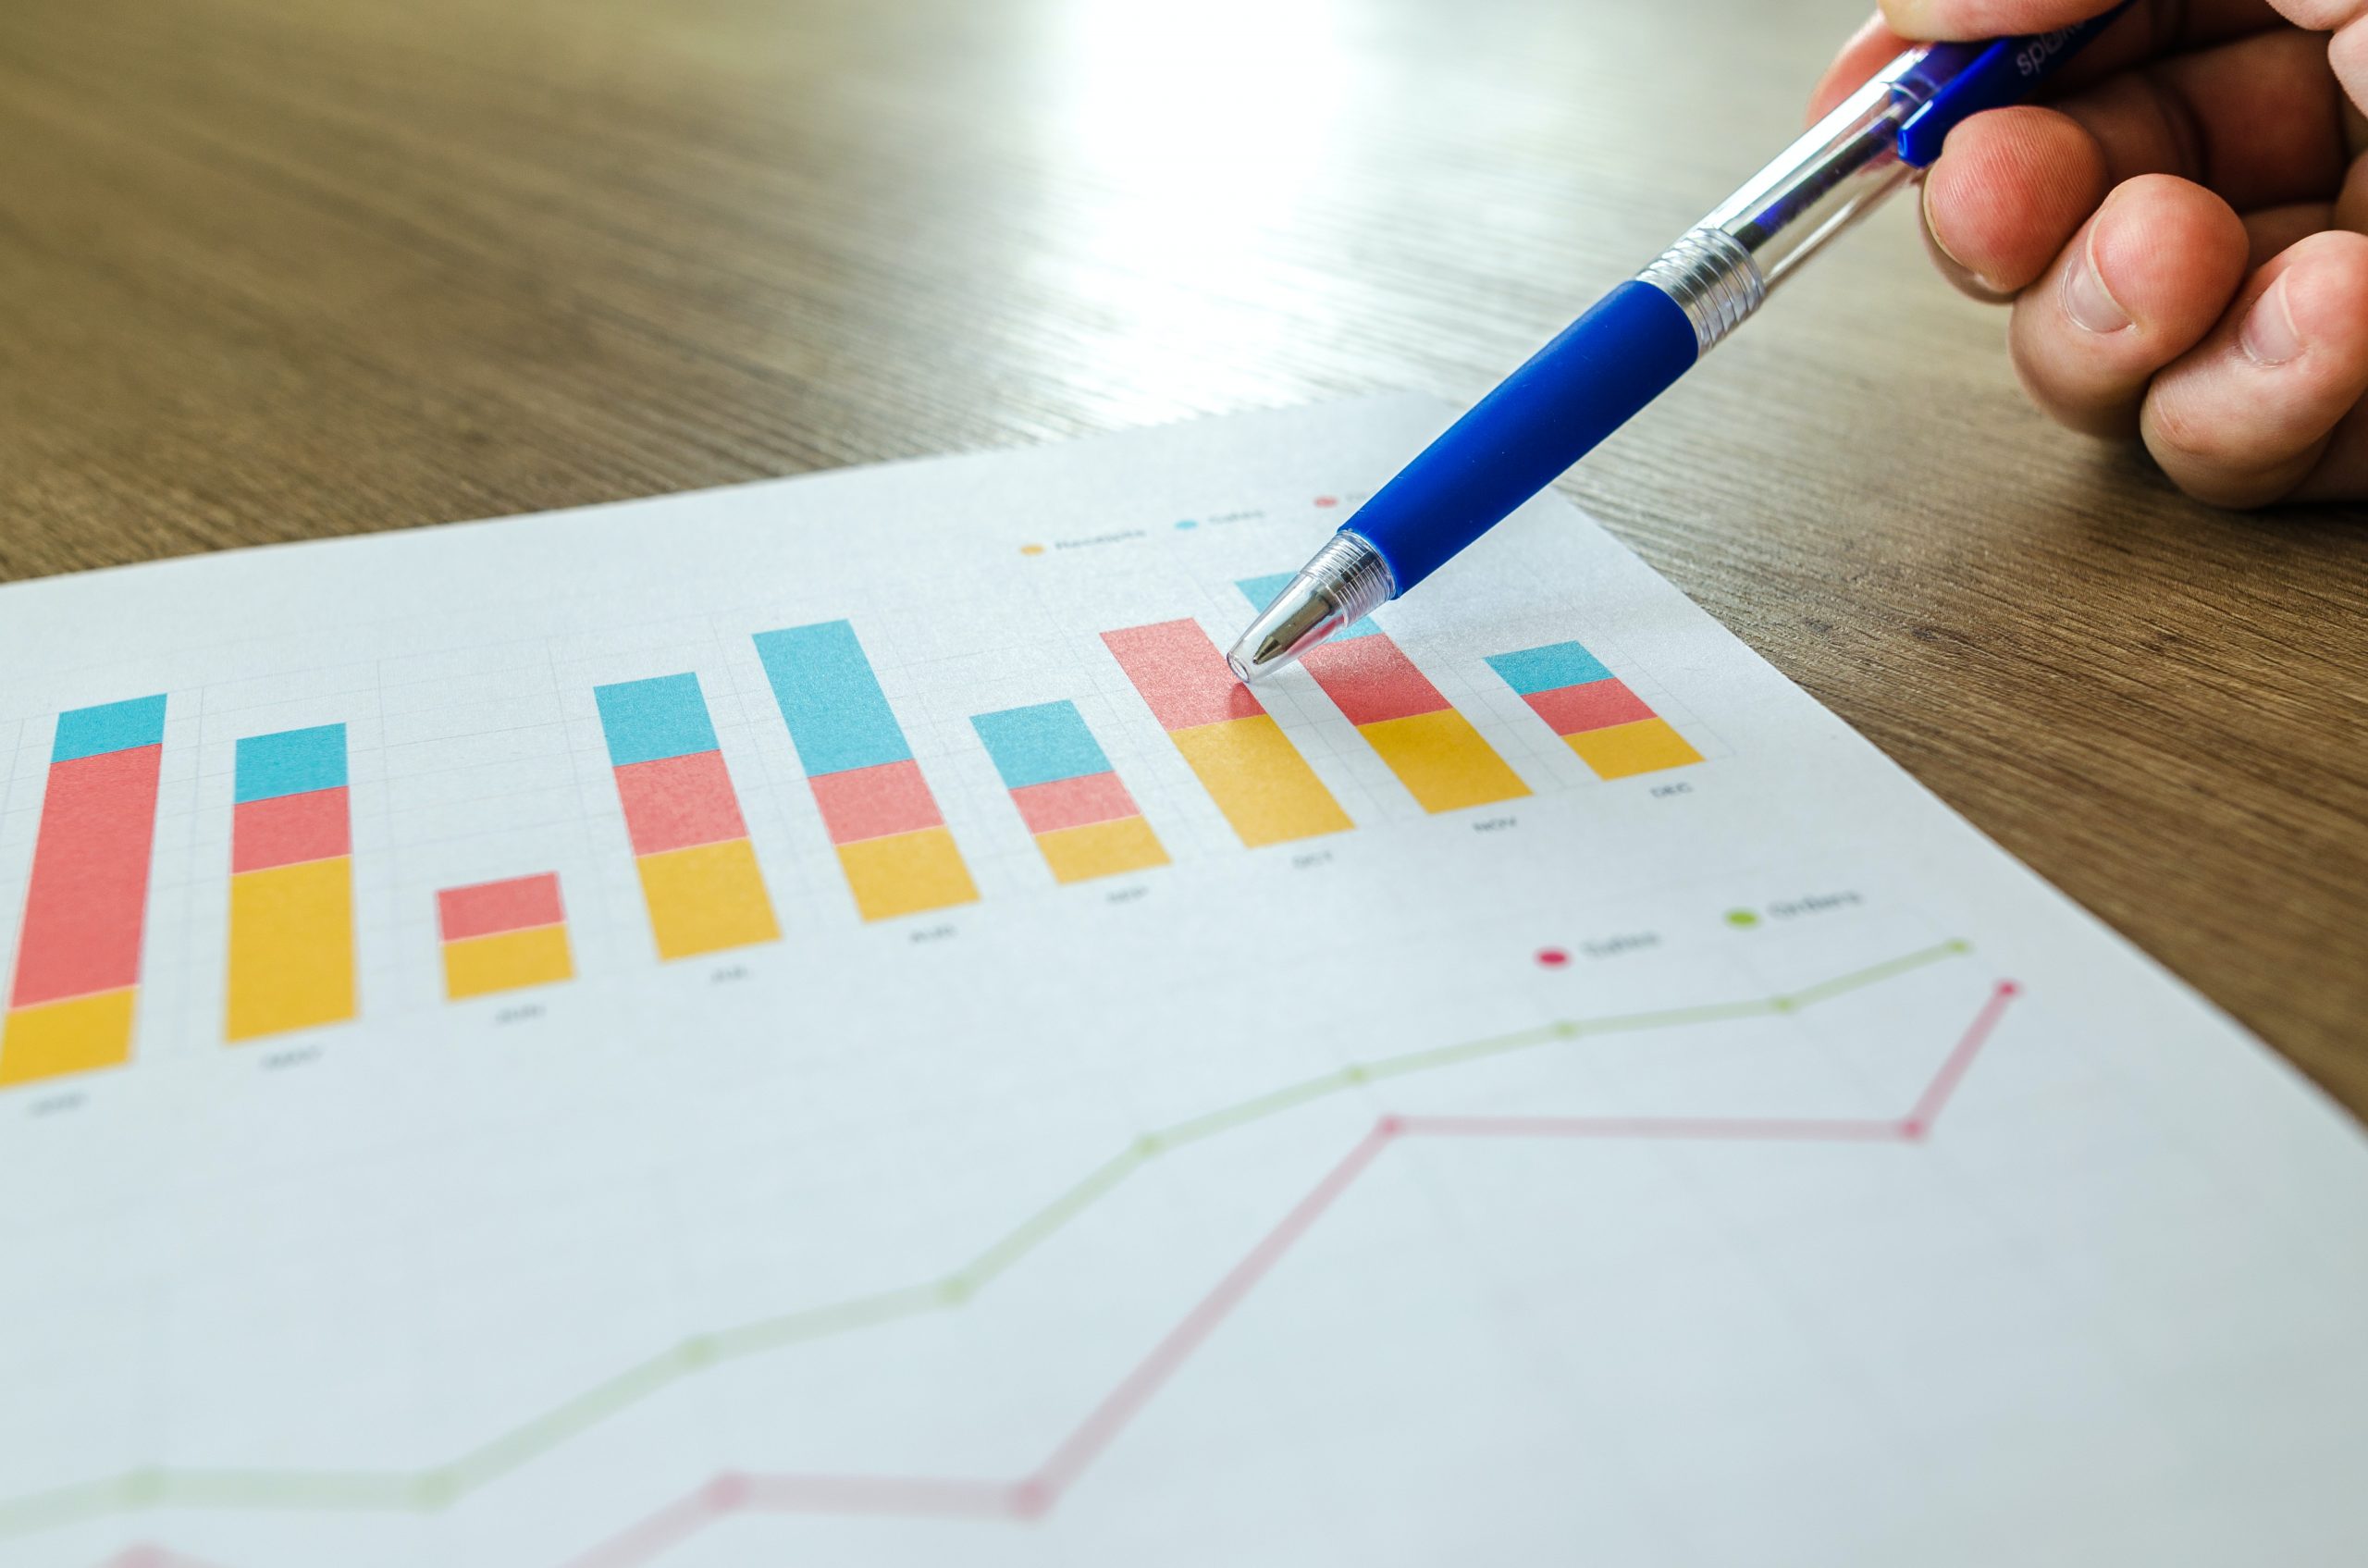
Reading and Comparing Bar Graphs

Standards CCSS.MATH.CONTENT.6.SP.B.5 Statistics & Probability: Summarize numerical data sets in relation to their context. CCSS.MATH.CONTENT.7.RP.A.2.B Ratios & Proportional Relationships: Identify the constant of proportionality (unit rate) in  tables, graphs, equations, diagrams, and verbal descriptions of proportional relationships. Lesson Time 40- 50 minutes Technology Required Device with web-browser – Chromebook, laptop or desktop computer, iPhone or iPad Summary

Video: Explaining Distributions and Variability

Explaining Distributions and Variability How can knowledge of distributions save you from angry, spear-wielding villagers? Watch this video from the AzTech series to find out.BONUS : Also available in Spanish below. Explicando distribuciones y variabilidad, con plátanos y aldeanos enojados. https://youtu.be/Pp4f0jOqrUU Explicando distribuciones y variabilidad, con plátanos y aldeanos enojados

Video: Finding the Average

Finding the Average What is the mean? Can you sing the formula for it? So first you are going to add up the numbers you have. The second step is to divide however many numbers there were in the first place. BONUS: Watch it in Spanish – extra bonus, no singing. Scroll down to Encontrando

Video: Why Did the Maya Hunt?

Why Did the Maya Hunt? What’s an X axis? What’s a Y axis? Another example of using bar graphs, explaining Mayan hunting practices.Scroll down to watch it in Spanish language version, “¿Por qué cazaban animales los Maya?” https://youtu.be/1r4wWMQC-cQ?list=PLlFtdlHUZsQuRezqE1Msot5FGA8xFcHez ¿Por qué cazaban animales los Maya? Una lección sobre gráficos de barras e historia al mismo tiempo.

Video: Mayan Trading

Mayan Trading Learning about distributions using bar graphs with examples from Mayan trading.Scroll down to watch the Spanish version, “El comercio Maya.” https://youtu.be/-fHjvhQS5b8?list=PLlFtdlHUZsQuRezqE1Msot5FGA8xFcHez El comercio Maya ¿Cómo vivieron los Maya? Los Maya no usaron dinero.

Lesson: Reading a Pictograph

Reading a Pictograph Pictographs are a fun, easy introduction to graphs. This video shows how to use a pictograph to answer questions, like how students get to school. This video and lesson slides are ready to go for your class. Students will learn the basics of how to use a graph. Video